The evidence

Design and calibration

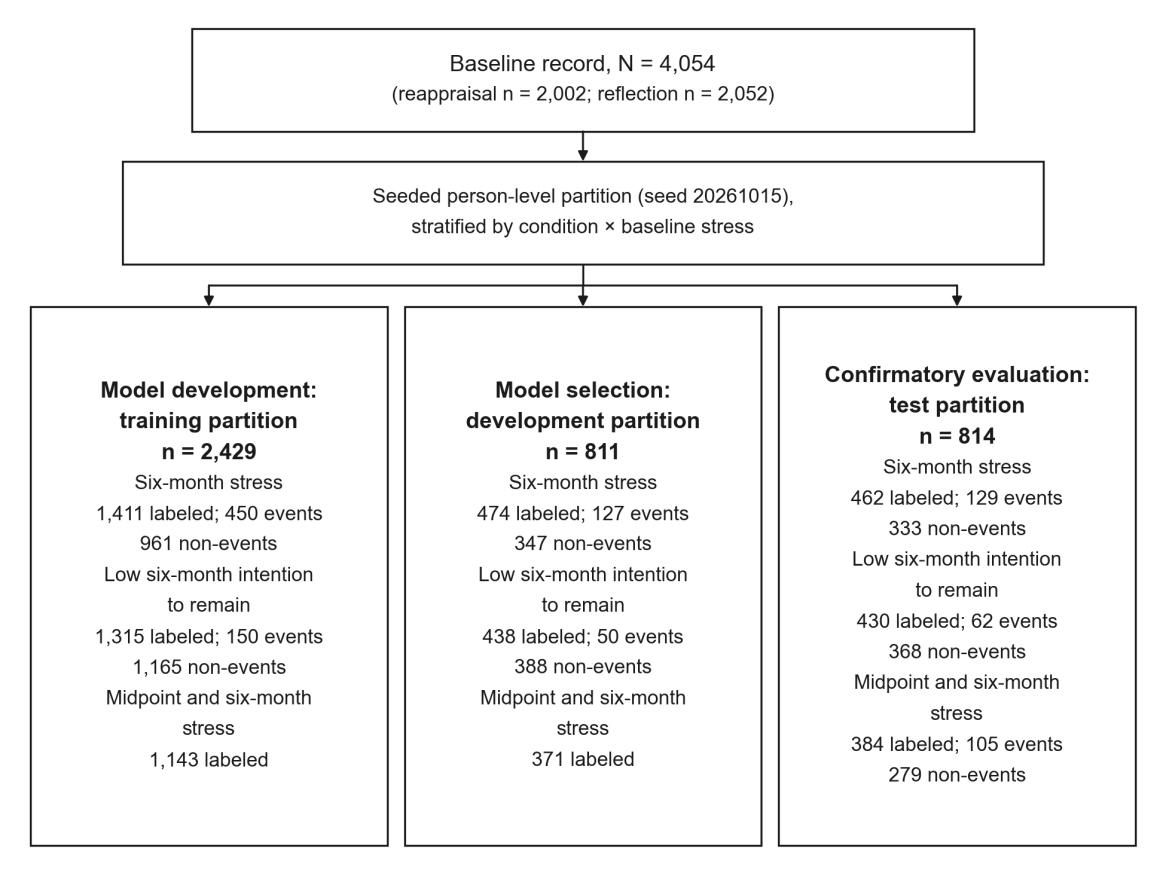
Flow chart. Baseline record N = 4,054 (reappraisal 2,002; reflection 2,052), split by a seeded person-level partition stratified by condition and baseline stress into training n = 2,429 (six-month stress 1,411 labeled, 450 events), development n = 811 (474 labeled, 127 events), and test n = 814 (six-month stress 462 labeled, 129 events; low intention to remain 430 labeled, 62 events).
Figure 1. Participant flow: training for fitting, development for one comparison of four pre-declared candidates, test for one pre-specified evaluation. Median follow-up was 184 days.
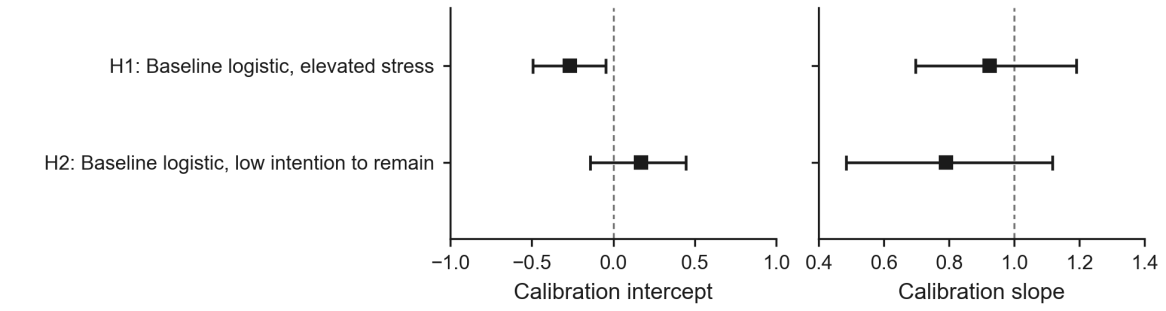
Two dot-and-interval panels for the two baseline logistic models. Left, calibration intercept: elevated stress near -0.27, low intention to remain near 0.17, with a dashed reference at 0. Right, calibration slope: elevated stress near 0.92 and low intention to remain near 0.79, with a dashed reference at 1.
Figure 3 (rows H1–H2). Calibration of the final 11-predictor model on the test partition. Elevated stress: slope 0.92 [0.70, 1.19]; low intention to remain: slope 0.79 [0.48, 1.12]. Ideal values are 0 for the intercept and 1 for the slope.