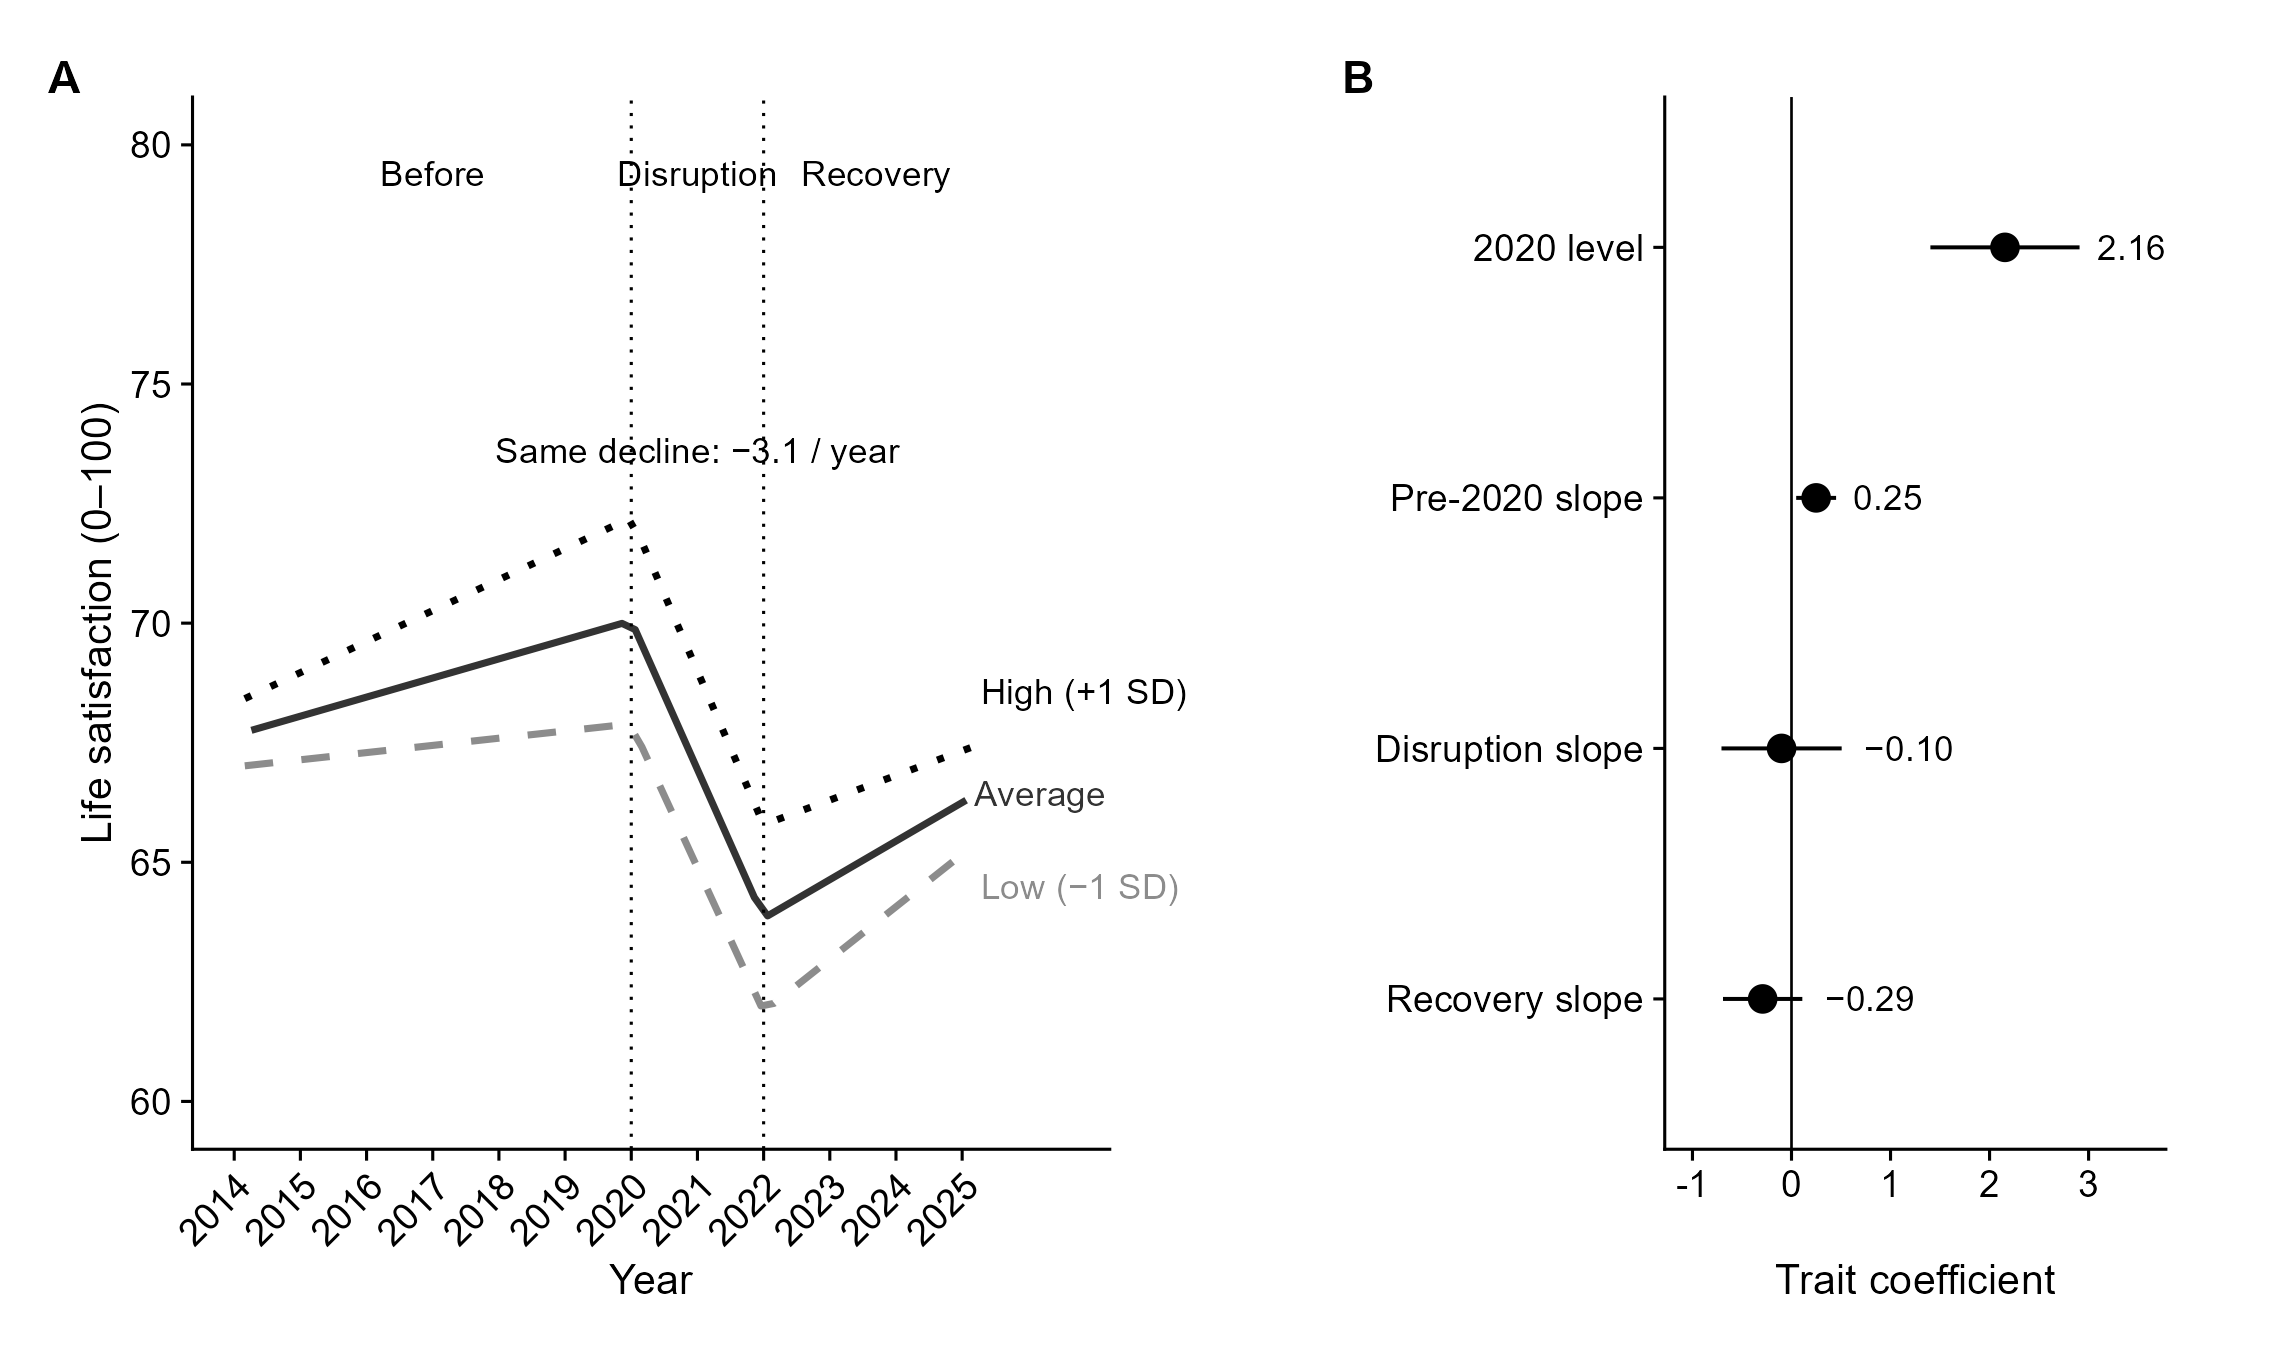
Hypothesis 1 · Disruption
Higher prepandemic self-compassion would be associated with a smaller 2020–2021 decline in life satisfaction and with lower 2020 loneliness. The decline was nearly uniform. 2020 loneliness was unrelated.
Employee well-being · Research companion
Conservation of resources theory treats self-compassion as a personal resource that should both sit with a higher baseline of well-being and blunt loss when a demand arrives. In the GESIS Panel.pop — a probability sample of German adults employed in 2018 (N = 3,052) — the second claim failed. Life satisfaction fell 6.22 points (0–100) across the 2020–2021 disruption at the same rate across levels of the trait. The first claim held later: the same 2018 measure was associated with lower loneliness and less digital overwhelm in 2024, and those associations ran through the self-critical items, not the self-caring ones.
Self-compassion was measured in 2018, before the disruption. The three tests ask different things of it: change under an acute demand, moderation of a within-person demand, and association with later appraisals.
Higher prepandemic self-compassion would be associated with a smaller 2020–2021 decline in life satisfaction and with lower 2020 loneliness. The decline was nearly uniform. 2020 loneliness was unrelated.
The trait would moderate within-person telework share (2021–2025). The interaction was not significant (p = .076). Simple slopes, read as descriptive, ran opposite the hypothesized buffer.
Lower digital overwhelm (β = −.20) and more favorable technology appraisals (β = .10). No association with a job-loss belief or with having recently learned a new tool.
The coefficients below are the published ones. They are associations in an observational panel, not effects of changing the trait.