The figures from the manuscript, with plain-language reading guides.
Study 1 is a stakes-moderated meta-analysis built on the public Stanek & Ones
(2023) database; Study 2 is the simulation behind the
calculator.
1 · Only the faked trait moves
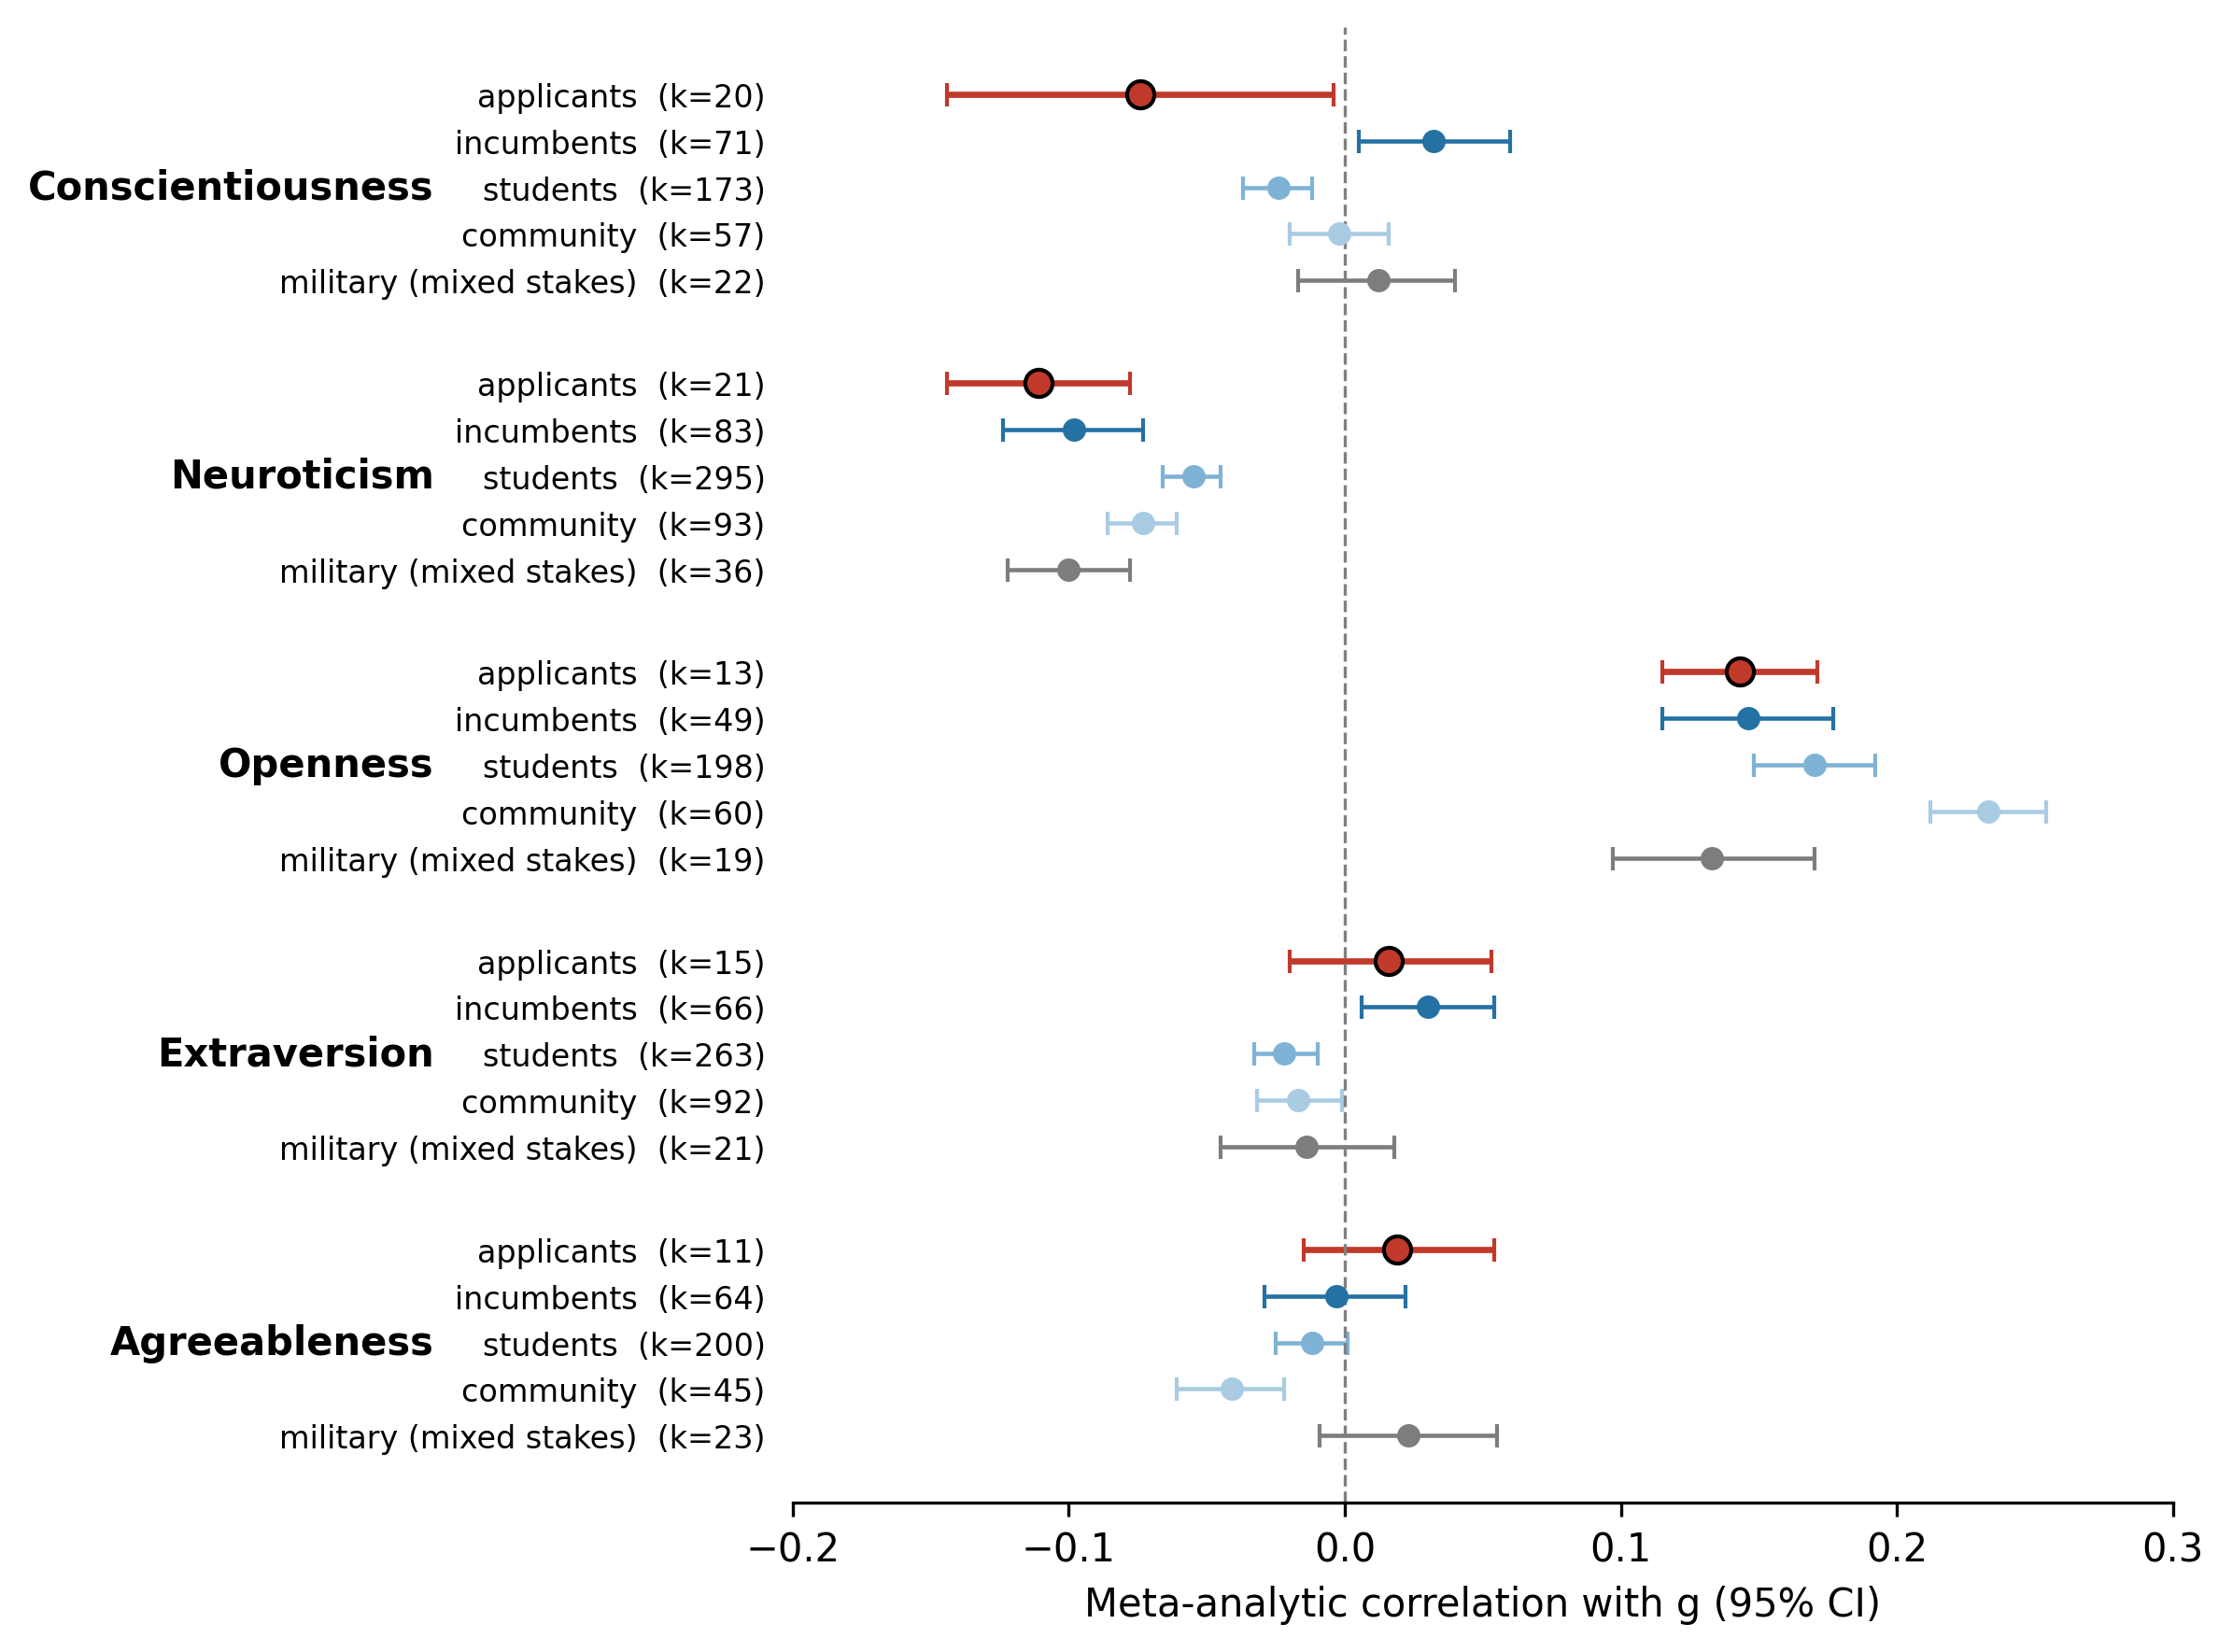
How to read it: each row is a meta-analytic estimate of
the correlation between a Big Five trait and cognitive ability for one kind of
sample; horizontal bars are 95% confidence intervals. Applicants (red) are people
tested with a job on the line. For four of the five traits, applicants look like
everyone else. For Conscientiousness — the trait hiring systems weight most,
and the one most worth faking — the applicant estimate sits on the other side
of zero from the incumbent estimate. That selective distortion is what a
compensatory faking account predicts.
2 · The same contrast, study by study
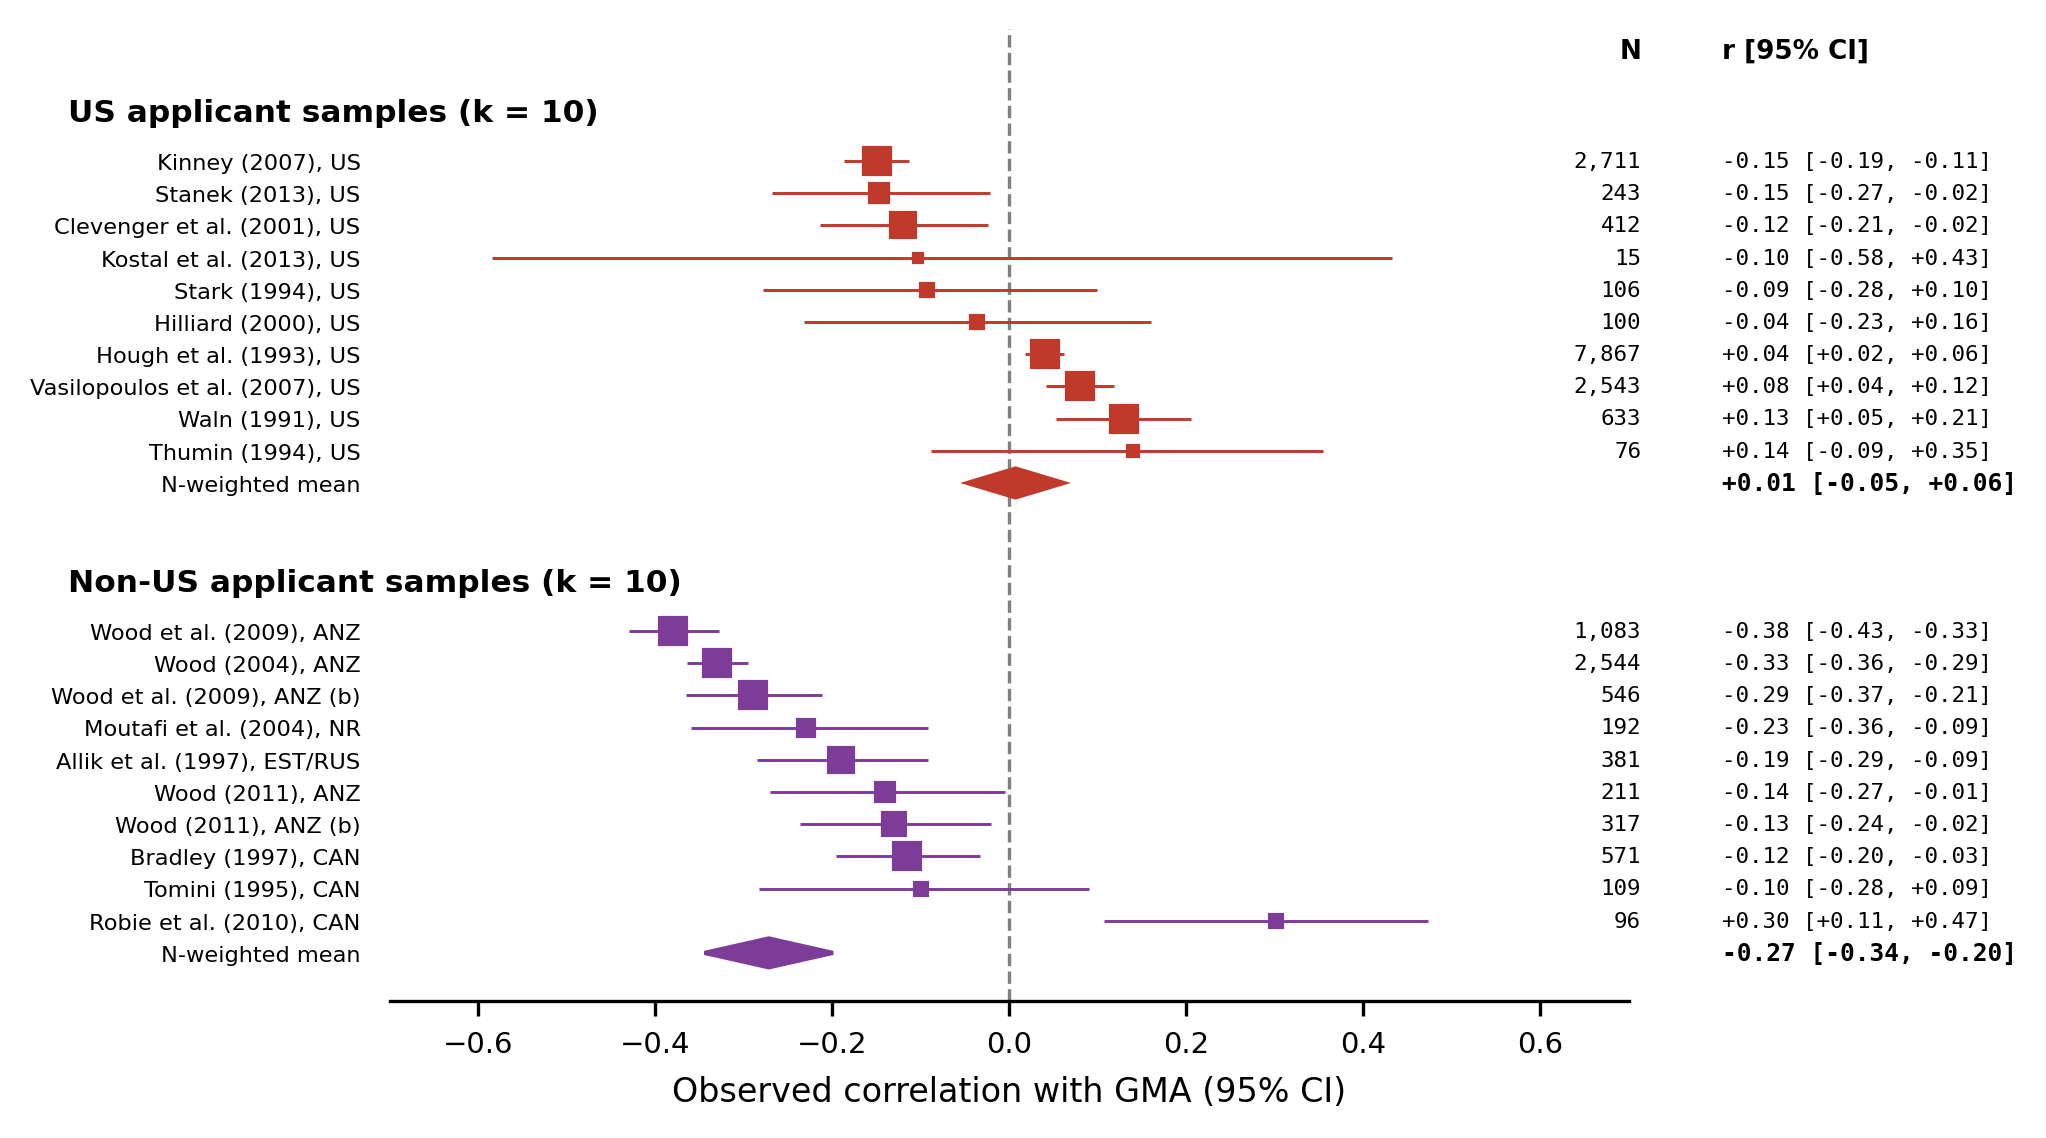
How to read it: every individual applicant sample in the
database, one row per study, with its sample size and confidence interval. The
negative applicant correlation is not one bad study — and it is not uniform
either. US applicant samples average +.01; non-US samples (Australia/New Zealand,
Canada, Europe) average −.27. The paper treats that regional split as a
finding to explain, not a nuisance: region is confounded with instrument family
and national selection practices, so the simulations are run separately per
context — which is why the calculator asks you to pick one.
3 · The mechanism, end to end
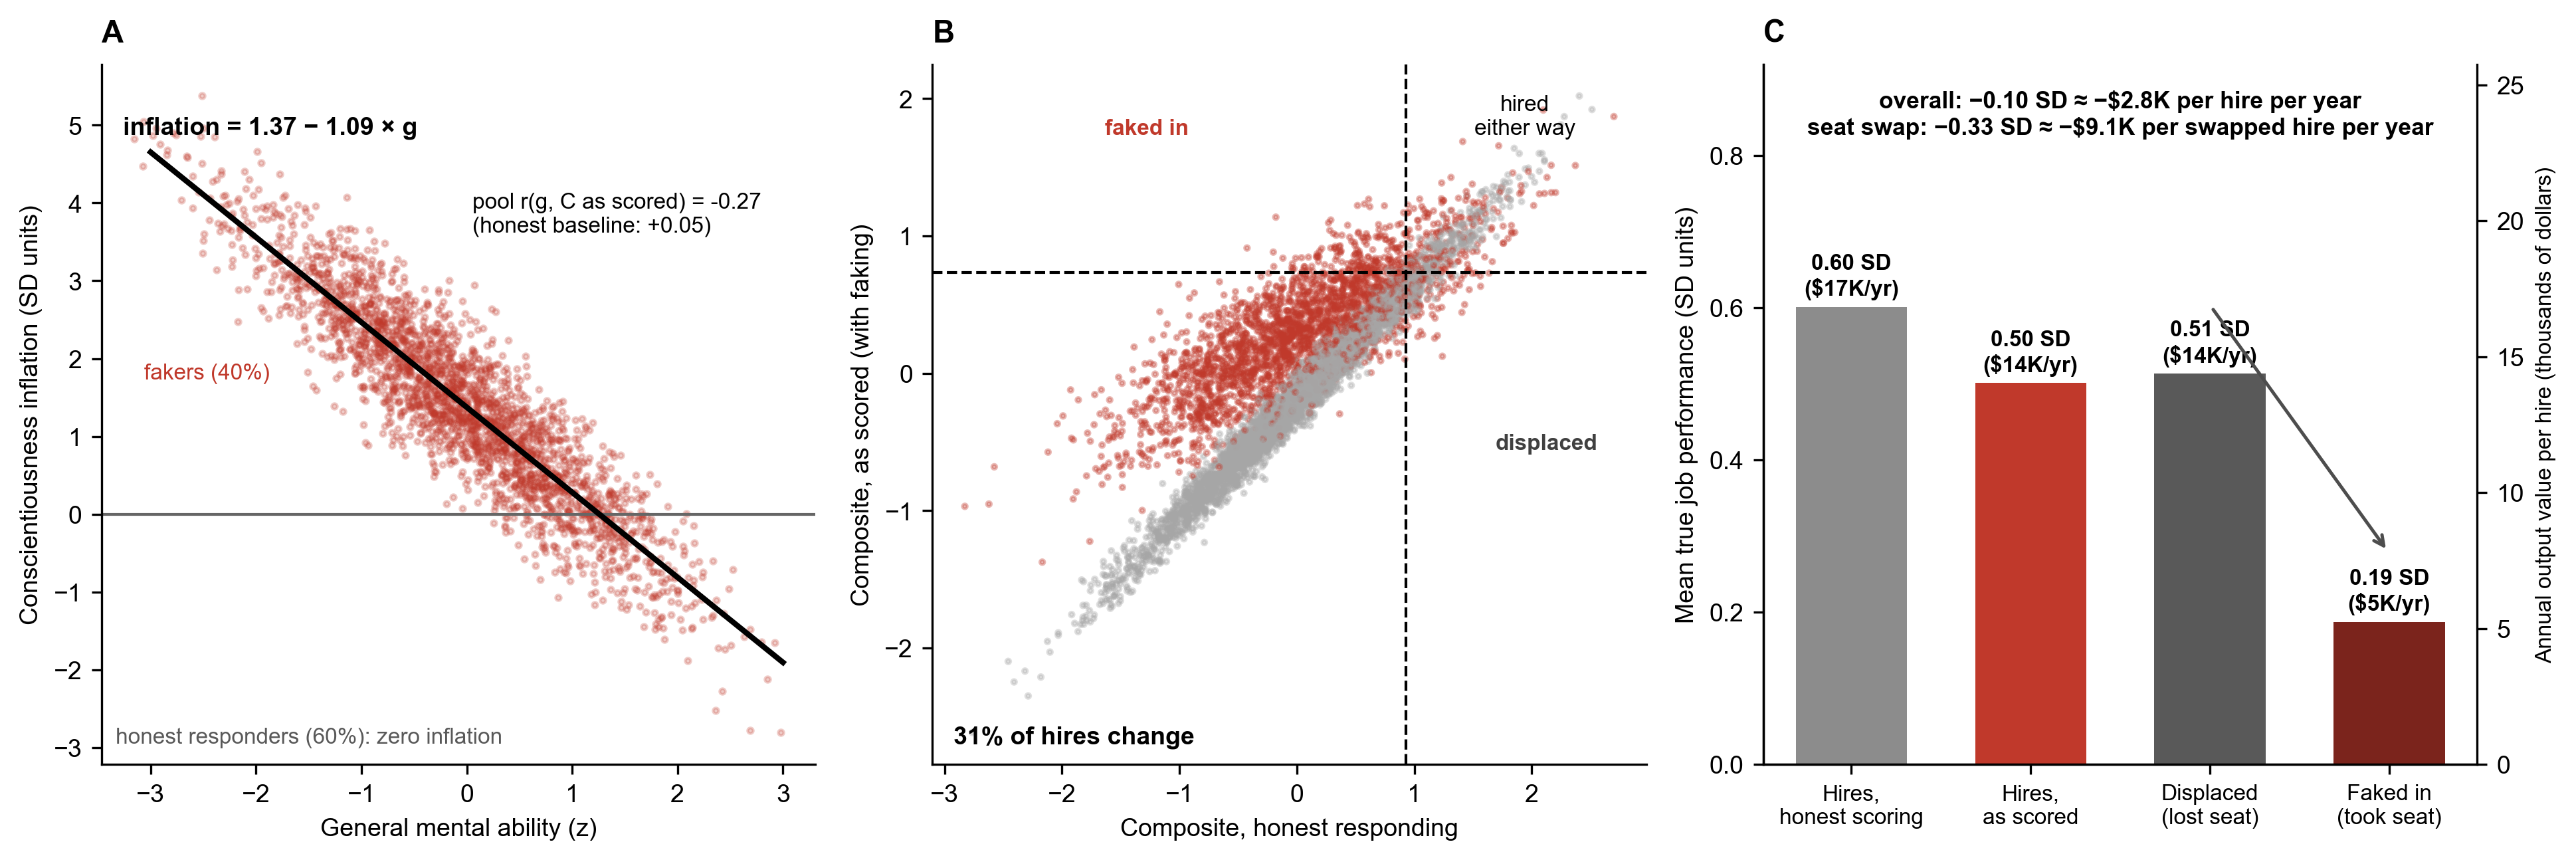
How to read it, left to right: (A) fakers add more
inflation the lower their ability — the same pattern as the scatter on the
overview page, here in the pool calibrated to r = −.27. (B) What
that does to the ranking: every red dot above the hiring line is an applicant who
got the job only because of faking; every gray dot pushed below it is the honest
applicant they displaced. In this pool, 31% of hires change. (C) The bill: the
applicants faked into seats truly perform 0.19 SD on the job against
0.51 SD for the people they displaced — roughly $9,100 per swapped
hire per year under the standard utility convention (performance SD in
dollars = 40% of salary).